↗ Bézier moi
I've been reading up on SVG and Bézier curves for a side project that involves a custom-made chart (blog post about that later!). Funnily enough, this article on Bézier curves popped up on Hacker News earlier this week.
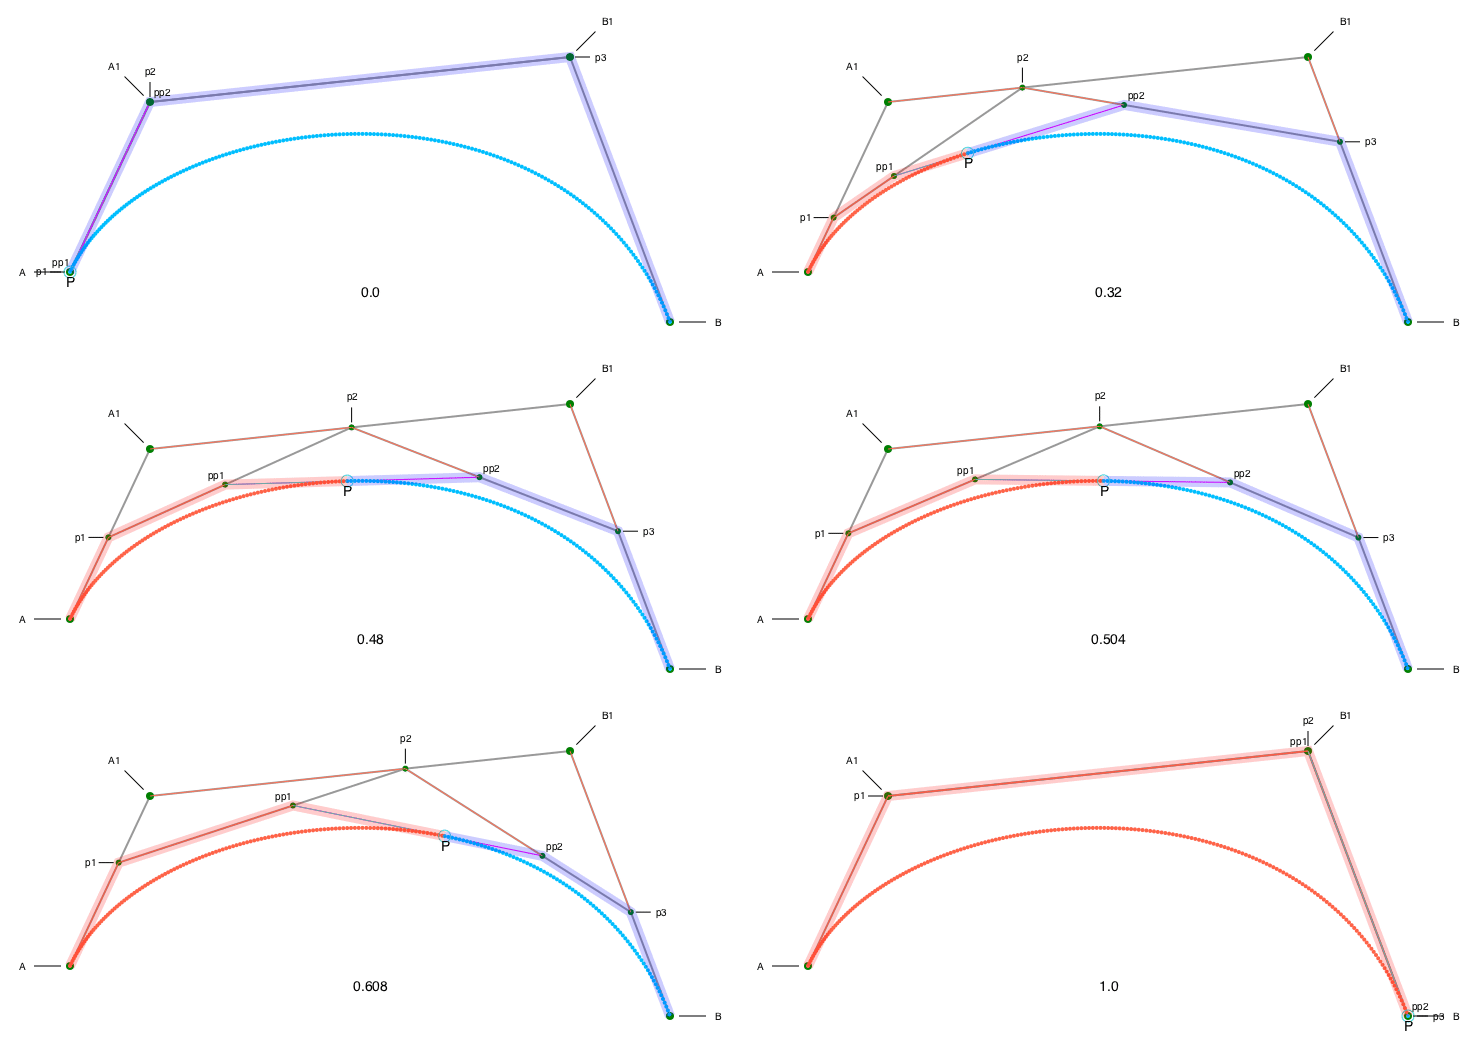
One little animation in the article totally stands out, and helped me make sense of what the control points of a Bézier curve actually do.

Taken from cormullion.github.io
While you’re waiting, have a look at another animation; this is my artist’s impression of the De Casteljau algorithm dividing the control polygons around a Bézier curve as the parameter n moves from 0 to 1. The idea is that as p1 divides A to A1, p2 divides A1 to B1 and p3 divides B1 to B. So, pp1 divides p1 to p2, and pp2 divides p2 to p3. And you keep doing this until you can’t divide any more, and eventually the point P plots the course of the final Bézier curve. The red and blue parts of the curve show that this technique is also a good way to split a single Bézier curve into two separate ones, and the red and blue parts are separate control polygons.
Read the full article on cormullion.github.io.
