Debugging application state triggered by focus
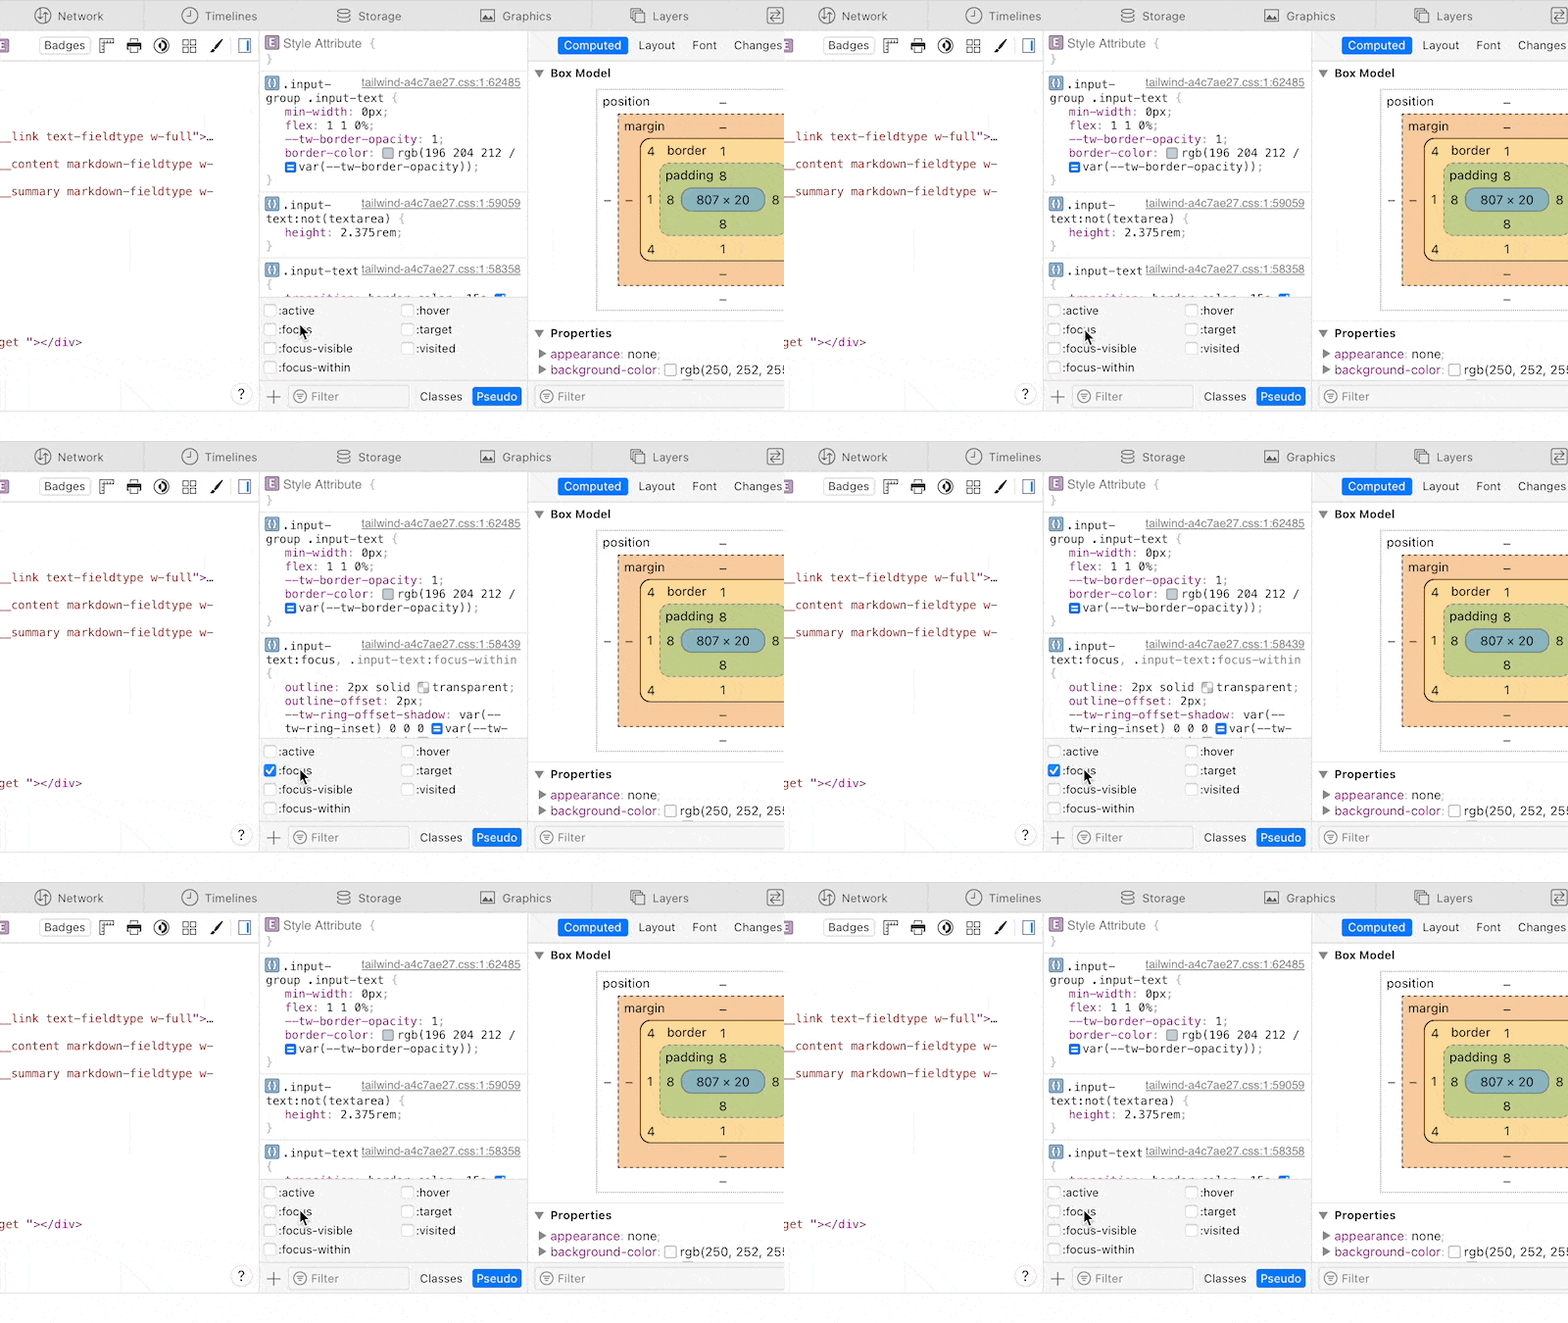
In any modern browser's element inspector, you can force an element into a :hover or :focus state to debug styling issues. Sometimes, you want to debug an issue of an element in focus with a state controlled by JavaScript. Unfortunately, the forced states from the developer console aren't always enough. (Edit: unless you use Chrome apparently, scroll to the end for an alternative solution!)

I came across this problem when I was styling a custom <select> component in React. The dropdown menu is only visible when the input is focussed, but I couldn't inspect this state with the devtools. Whenever I wanted to browse the element tree, the devtools became the active element on the page and the menu disappeared.
Luckily, I came across a tiny snippet to help debug in this situation.
window.setTimeout(() => { debugger; }, 5000);This will wait five seconds until it halts all code execution with a debugger breakpoint. With this snippet, I load the page, set everything up into the state I want to inspect—5 seconds is more than enough time—and wait for the timeout to fire. When the debugger is triggered, I can browse and tinker with the element tree without worrying about the page updating.
In React, I wrapped this in a useEffect call to run once for the component I wanted to debug.
useEffect(() => { window.setTimeout(() => { debugger; }, 5000);}, []);After I shared this post on Twitter, Bram tweeted that Chrome DevTools have a feature to circumvent this problem. With the "Emulate a focussed page" setting, the web page will remain in a focussed state when you're playing around in DevTools. Read more in the Chrome DevTool release notes.
